Advanced Calculators
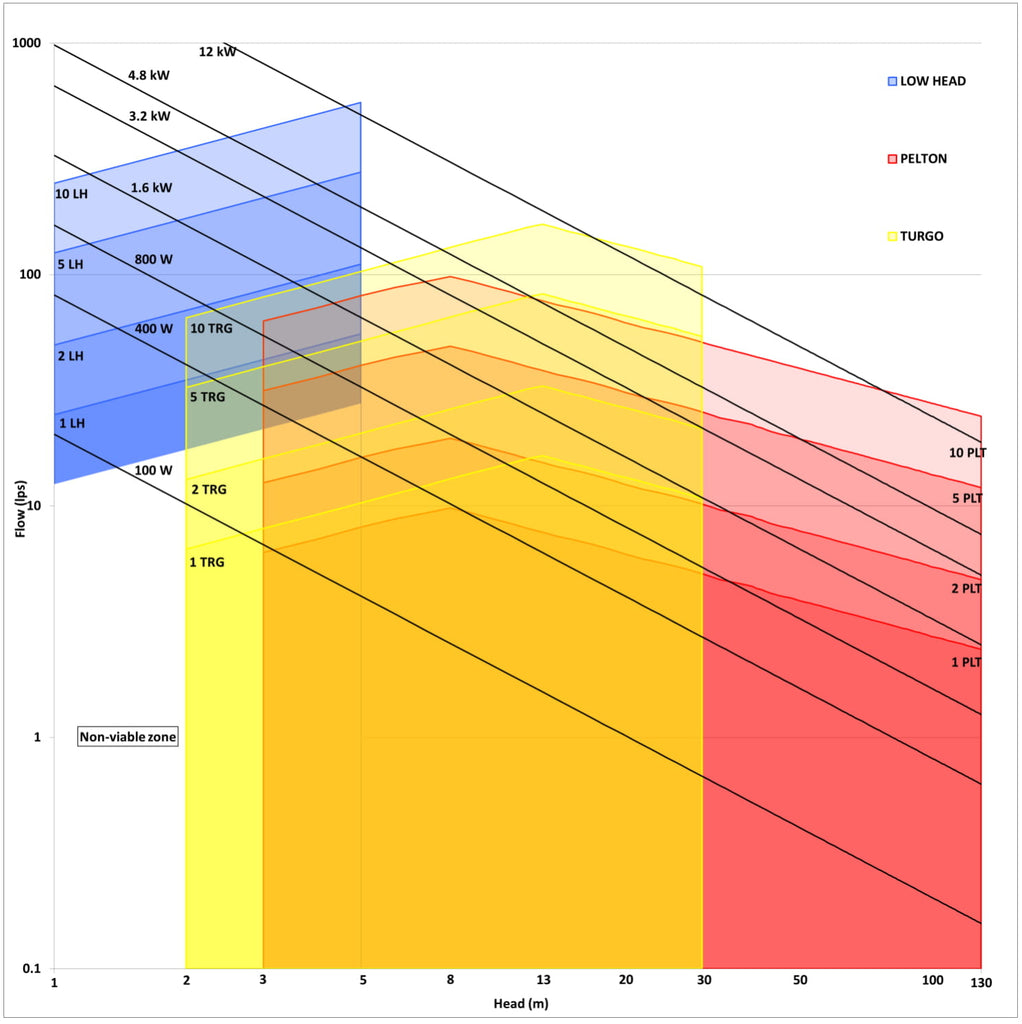
PowerSpout Model Selection Chart

Please note the Flow and Head axis are both log scales.
For the head and flow rate at your site the above chart will quickly give you the maximum power you can generate (refer to black angled lines 100W to 12kW).
Once you have identified the most suitable turbine type(s), use the Advanced Calculation Tools above to perform accurate site calculations.
The red lines are 1,2,5,10 PowerSpout Pelton (PLT) turbines respectively
The yellow lines are 1,2,5,10 PowerSpout Turgo (TRG) turbines respectively
The blue lines are 1,2,5,10 PowerSpout Low Head (LH) turbines respectively


